
It is easy to assume the big startup wins are already gone once an Android app is modern, uses Compose, has reasonable structure, and does not feel obviously slow. That was my starting assumption here too.
It turned out to be wrong.
I was working on a modern Compose app with two materially different startup paths: an initial setup flow and a direct launch into the main operational screen. The app already had a lot going for it: baseline profile support, startup benchmarks, tracing, and a codebase that was not a cleanup disaster.
And yet there was still a 34% startup win left to find.
What made the result interesting was that it did not come from one silver bullet. I added recomposition instrumentation to make the UI easier to reason about, and then a StrictMode pass to clean up startup and settings behavior. Baseline profiles helped. Macrobenchmarks helped me prove it. But the biggest absolute gains came from cleanup work that did not start life as “performance optimization.”
This also was not my first time doing this kind of work. I have gone through similar startup and baseline-profile investigations on four different apps. That matters, because it is easy to talk about performance tooling as if the outcome is always predictable once you add the recommended pieces. It is not. In one of those apps, baseline profiles actually made startup slower. So while this article is anchored in one project, the conclusions are coming from repeated attempts across different codebases, not from a single lucky result.
The short version is this:
- Baseline profiles were a clear, repeatable win.
- Macrobenchmarks mattered because startup was not one flow.
- Recomposition instrumentation improved visibility more than raw startup numbers.
- A later cleanup pass triggered by StrictMode and product sanity work ended up improving absolute startup by 18 to 34 percent, even though it did not begin as a startup optimization task.
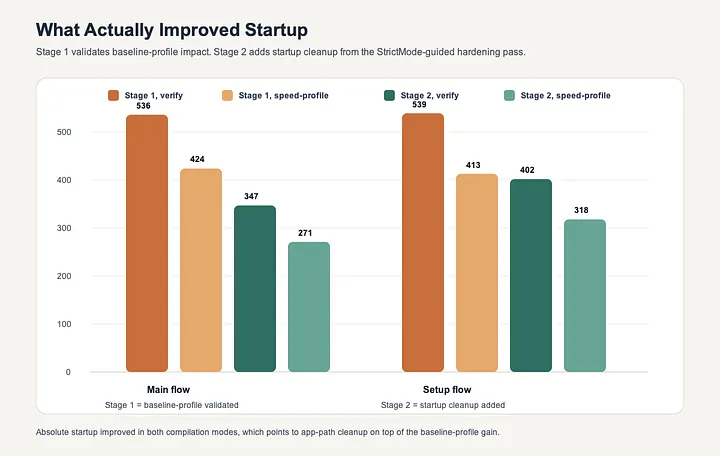
The Startup Story Happened In Stages
One reason date-based charts are misleading is that they flatten the work into calendar points instead of engineering stages.
What actually happened was closer to this:
- Stage 1: validate that the baseline profile is materially helping startup on the current app behavior
- Stage 2: do a StrictMode-guided cleanup and product-hardening pass, then benchmark again to see whether absolute startup changed
That distinction matters because the later gains were not “more baseline profile work.” The baseline profile was still helping, but the bigger absolute shift came from cleaning up behavior around the startup path.
So when I compare the two benchmark snapshots in this article, I am not really comparing dates. I am comparing two technical stages:
- `Stage 1`: baseline-profile benefit validated on the earlier tree
- `Stage 2`: baseline profile still present, but now on top of startup cleanup from the StrictMode/product-hardening pass
Baseline Profiles Were The Most Predictable Win
The easiest part of the story to defend is baseline profile impact, because the measurement setup makes the comparison explicit.
The benchmark script measures the app in two compilation modes inside one run:
- `before`: package compiled with `verify`- `after`: package compiled with `speed-profile`
That means each run tells me what the baseline profile is doing on the current tree, not just whether startup changed for some unrelated reason.
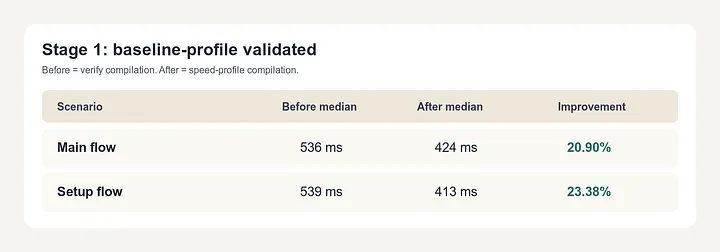
At `Stage 1`, where the main recent change was baseline-profile validation and refresh, the benchmark showed:
At `Stage 2`, after the StrictMode-guided cleanup and product-hardening pass, the benchmark still showed a strong baseline-profile effect:
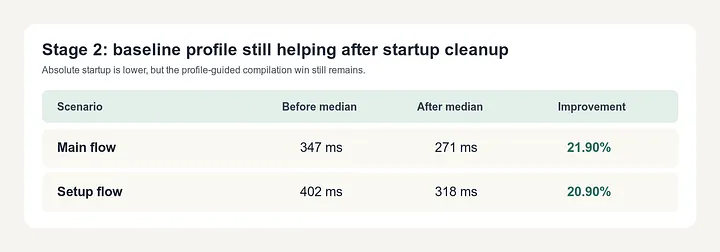
That consistency matters. The baseline profile was not a one-off win that disappeared as the app changed. It stayed useful even after the rest of the startup path improved.
It also clarifies what changed between the two stages. The baseline-profile effect stayed in roughly the same range. The absolute startup numbers improved because the app itself got cleaner on the path to first frame and early interaction.
It is also worth saying the uncomfortable part clearly: baseline profiles are not magic, and they are not automatically a win just because you generated one. In one of the four apps where I have done this work, enabling the baseline profile made startup slower. That is exactly why I care so much about measuring the before and after on the actual app instead of treating baseline profiles as something you add on faith.
This is also why I like showing the benchmark harness instead of only showing a final chart. The script is simple enough to audit. It force-stops the app, clears package state, compiles with a specific mode, launches with `am start -S -W`, and stores raw `TotalTime` samples before summarizing medians.
adb shell pm clear "$PKG" >/dev/null
adb shell cmd package compile - reset "$PKG" >/dev/null
adb shell cmd package compile -f -m "$compile_mode" "$PKG" >/dev/null
That is not glamorous, but it keeps the story grounded.
Startup Was Not One Flow, So The Benchmark Could Not Be One Test
A lot of startup work gets flattened into a single launcher metric. That was not credible for this app.
There were two startup paths that mattered:
- `setup_flow`, where onboarding is not done yet- `main_flow`, where the app launches directly into the primary screen
The benchmark module measures both explicitly:
That is a small detail, but it changed how I thought about startup work. If I had only measured the happy-path launcher case, I would have missed the fact that setup and direct-entry launches were both worth tracking and both responded slightly differently to changes.
This also made the eventual benchmark data more persuasive. When both scenarios improve, the result is harder to dismiss as a path-specific accident.
Standard Tooling Helped, But It Was Not Fully Reliable
One part of the work was much messier than I expected: baseline profile generation itself.
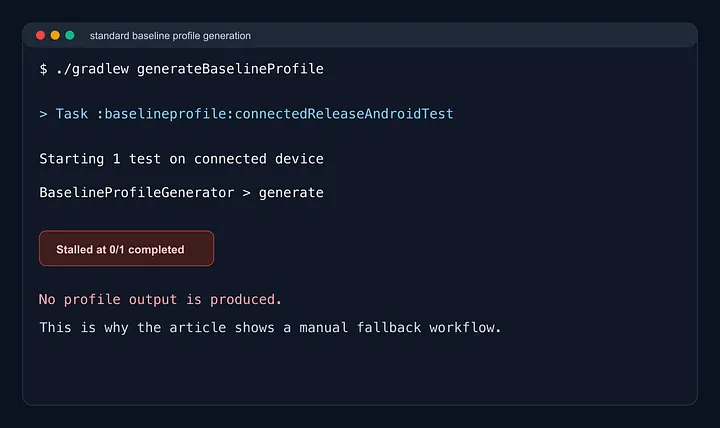
The usual `BaselineProfileRule` path was not reliably returning on this device. I upgraded AndroidX benchmark artifacts, reduced idle waiting, and isolated the generation test more aggressively. The run still hung at `0/1 completed`.
That could have turned into one of those situations where the team shrugs, leaves the checked-in profile alone, and keeps talking about baseline profiles as if the workflow were stable. I did not want that.
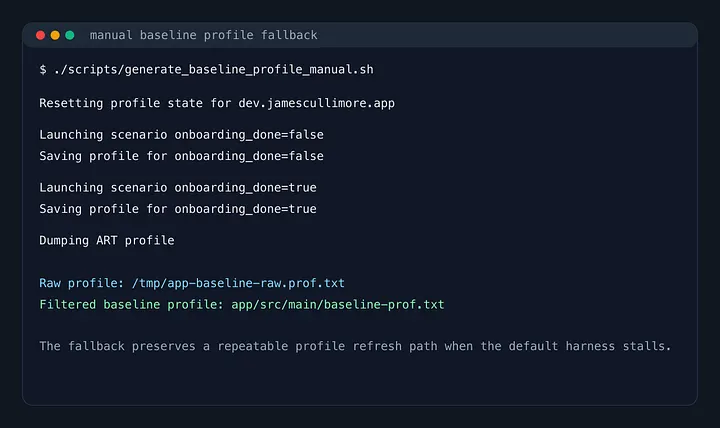
So the project ended up with a manual fallback generator that launches the relevant scenarios, triggers `androidx.profileinstaller.action.SAVE_PROFILE`, dumps the ART profile, and filters it into `baseline-prof.txt`.
I would not present that as the ideal workflow. I would present it as the honest one. Official tooling is still the right first choice, but if it is unstable in your environment, you need a fallback that preserves confidence instead of hand-waving around the problem.
That is part of the real performance story too. Sometimes the hard part is not identifying an optimization. It is creating a workflow you can trust enough to keep using.
Recomposition Instrumentation Was More About Visibility Than Raw Startup
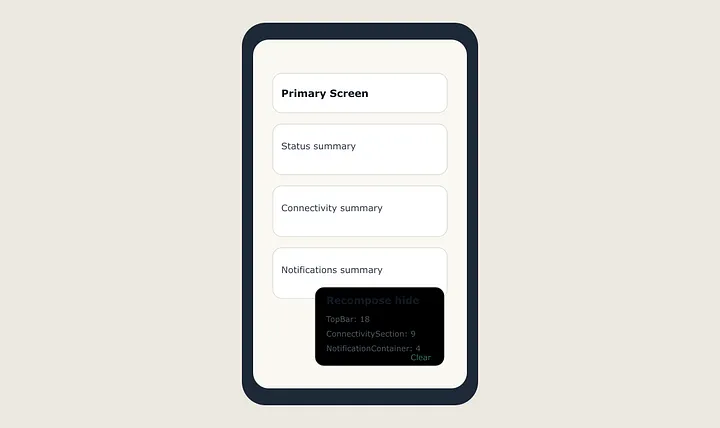
I also wanted better visibility into what the main Compose surface was doing once it had launched. That led to a small debug-only recomposition overlay on the primary screen.
The overlay tracks section-level recompositions and exposes them in the UI:
@Composable
private fun DebugRecomposeCounter(section: String) {
   ...
}
And because debug-only tools have a habit of rotting when they are not exercised, there is also an Android test that expands the overlay, checks that rows appear, clears them, and verifies the rows reset.
This part is worth framing carefully. Recomposition instrumentation did not suddenly explain startup all by itself. It was not the source of the 20 percent baseline-profile win, and it was not the main cause of the later absolute startup improvement either.
What it did do was make the UI less opaque. It gave me a faster way to reason about whether state slicing and UI updates were behaving sanely in the most important screen. That kind of visibility matters, even when the direct win is confidence rather than a benchmark number.
Stage 2 Was Not “More Baseline Profile Work”
This is the part that is easiest to misrepresent if the chart only shows numbers without saying what changed.
The `Stage 2` improvement did not come from a second wave of profile tuning. It came from a cleanup pass that reduced avoidable work and instability around startup. StrictMode helped push that work into view, but the gains came from the code and product changes that followed.
The most important ones were:
- removing a receiver-driven UI relaunch path that was creating lifecycle instability
- moving display-settings and provider reads off the critical UI path
- moving blocking event-reporting process I/O off inline execution and giving it a fallback path
- stopping privileged settings screens from thrashing unavailable operations during interaction
That is why the Stage 2 numbers are better in both compilation modes. If the win had been only about baseline profiles, I would expect the `speed-profile` side to improve more than the `verify` side. Instead, both sides improved because the underlying startup path got healthier.
StrictMode Did Not Find A Bunch Of Classic Startup Violations, But It Still Led To Faster Startup
This was the most interesting part of the work. I added debug-only StrictMode wiring expecting the usual outcome: find obvious disk or network work on the main thread, fix it, and call that the startup story.
That was not really what happened. StrictMode did not surface a huge list of dramatic app-originated startup violations. What it did do was push a set of adjacent quality problems into view:
- a boot receiver that was relaunching UI from background events
- settings screens that looked interactive even when the required privileges were unavailable
- blocking process I/O in event reporting
- provider and preferences reads sitting on the critical UI path
Those do not all read like “startup optimizations” on paper. But once they were cleaned up, startup got meaningfully faster.
To isolate that pass, I compared the Stage 2 tree against a temporary copy where only the cleanup-pass files were reverted. That gave a practical A/B comparison without rewriting local history.
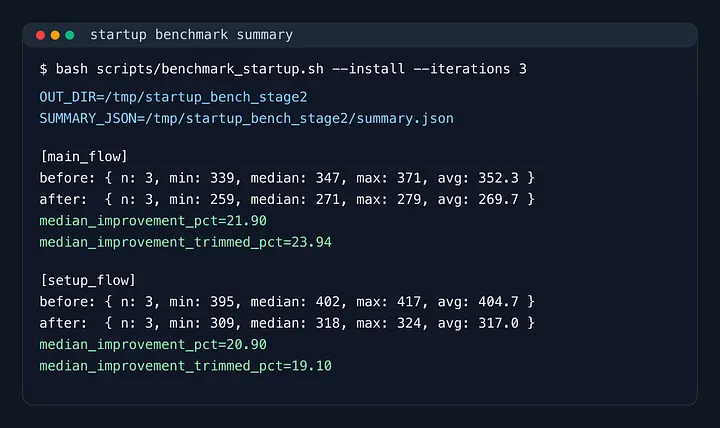
The result was larger than I expected:
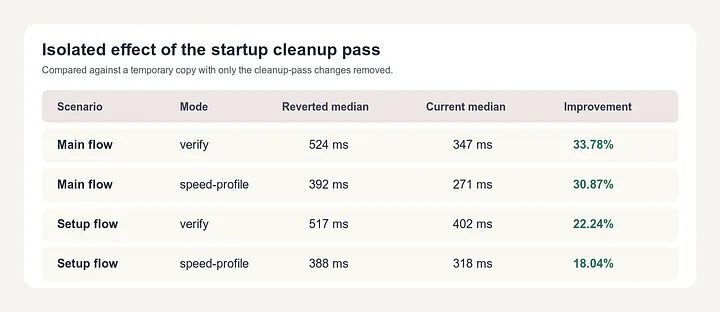
That is the point where the article title became obvious to me. The question was no longer “did baseline profiles help?” They did. The more useful question was what actually improved startup in this app.
Part of the answer was baseline profiles. Part of it was measurement discipline. But part of it was also product-hardening work that removed launch chaos, reduced main-thread initialization pressure, and stopped doing questionable things during early app life cycle.
Two of the changes were especially representative.
The boot receiver stopped force-launching the UI and now only starts the service:
The display settings state stopped doing the full read inline on first composition and now hydrates asynchronously after the first frame:
Neither of those changes is especially glamorous. Both are the kind of cleanup that often gets filed under product sanity or engineering quality rather than performance. In practice, they still changed the startup path.
The Practical Workflow That Held Up
By the end of this work, the performance workflow that felt defensible was much simpler than the full journey:
- Measure more than one startup path.
- Keep baseline profiles because they are a repeatable win.
- Add lightweight instrumentation where the UI is too opaque.
- Use StrictMode as a quality tool, not just a violation counter.
- Benchmark again after cleanup work that is not obviously “performance work.”
That last step is the one I would stress most.
If I had only benchmarked after baseline profile changes, I would have learned something true but incomplete. If I had only done cleanup work without benchmarking, I would have had a nicer architecture story and weaker evidence. The value came from combining both.
Closing Thoughts
The simple version of this story would be: baseline profiles improved startup, macrobenchmarks proved it, and recomposition tooling helped refine Compose behavior. That is true, but incomplete.
In this app, baseline profiles were the most predictable win. Macrobenchmarks mattered because startup was not one path. Recomposition instrumentation helped me see what the main screen was doing. But the biggest surprise was that a StrictMode-led cleanup pass improved absolute startup even more than some of the explicitly performance-branded work.
That is the part I would carry into the next app. Performance work is not only about the optimizations you set out to make. Sometimes it comes from using the right tools to expose product and lifecycle problems that were already sitting on the startup path.
It is also why I no longer talk about baseline profiles as a checkbox. I have now done this work across four apps, and the results were not identical. In this app, the baseline profile was a real win. In another, it made startup worse. The common rule was not “baseline profiles always help.” The common rule was “measure the app you actually have, then keep only what improves it.”